Blogs
The latest cybersecurity trends, best practices, security vulnerabilities, and more

Uncover the Hidden Story of Ransomware Victims – They’re Not Who You Think
By Trellix Advanced Research Center · July 31, 2023
Ransomware attacks against large corporations often dominate headlines. High-profile attacks against organizations like Kaseya, Colonial Pipeline, and MOVEit might make you think that ransomware gangs are only after large organizations. Our research shows this isn’t always the case.
Thinking that only large organizations are at risk may lead you to underestimate your own likelihood of being attacked. Use our analysis of recent ransomware incidents to see your organization’s similarity to other ransomware victims so you can plug cybersecurity gaps before an attack occurs.
Our methodology and source of ransomware statistics
Any organization can fall victim to ransomware. To get an idea of what the “average victim” looks like, Trellix Advanced Research Center collected years’ worth of data on publicly extorted ransomware victims from criminal leak sites up to the beginning of June 2023, (just before the enormous MOVEit breach by the Clop gang). This effort resulted in a staggering list of close to 9,000 confirmed global ransomware victims.
We enriched the list of victims’ names with more details about the organizations, such as company sector, location, revenue size, company size, etc. By applying statistics, we were able to gather interesting insights into the profile of the typical victim. From experience we know that not all victims will be listed on these sites, so there will be many more victims out there. Note that findings shown in this blog are based only on data we have collected.
In this blog, we will delve into the fascinating world of ransomware victims and uncover their demographics. By examining the victim organizations that are comparable with your own, you can see if you are at risk. Most likely those organizations will have a similar IT security budget and have implemented similar controls. To quote Socrates: “Intelligent individuals learn from everything and everyone; average people, from their experiences. The stupid already have all the answers.” Perhaps you have even learned from your peers what caused an attack and which controls were lacking in their defense strategy.
Join us as we unravel the mysteries surrounding ransomware victims, and together, we'll empower ourselves to combat this digital menace and safeguard our valuable data.
Victims per ransomware group
The data collected span across 97 different ransomware groups over two years. The shortened list below reveals that Lockbit ransomware has been the clear leader when it comes to publicly extorting victims on their leak page. Please note that these numbers were gathered just before the MOVEit Clop attack at the end of June 2023, which would have pushed Clop far above Lockbit.
Company size by employees globally
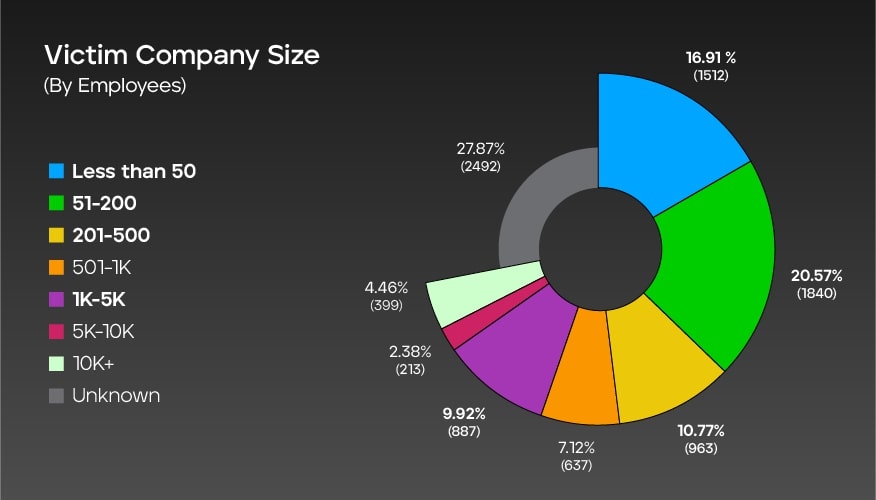
This graph represents the distribution of global ransomware victims based on the size of victim companies (measured by the number of employees). The data shows that most victims are from companies with 51-200 employees (20.57%), followed by companies with less than 50 employees (16.91%). The percentages decrease for larger companies as follows:
- 501-1,000 at 7.12%
- 1,000-5,000 at 9.92%
- 5,000-10,000 at 2.38%
- 10,000+ at 4.46%
Additionally, there is a category labeled "unknown," accounting for 27.87% of the total, indicating that the company size of some victims is not known. The total number of ransomware victims considered in this data is 8,943.
Company size by employees: U.S.
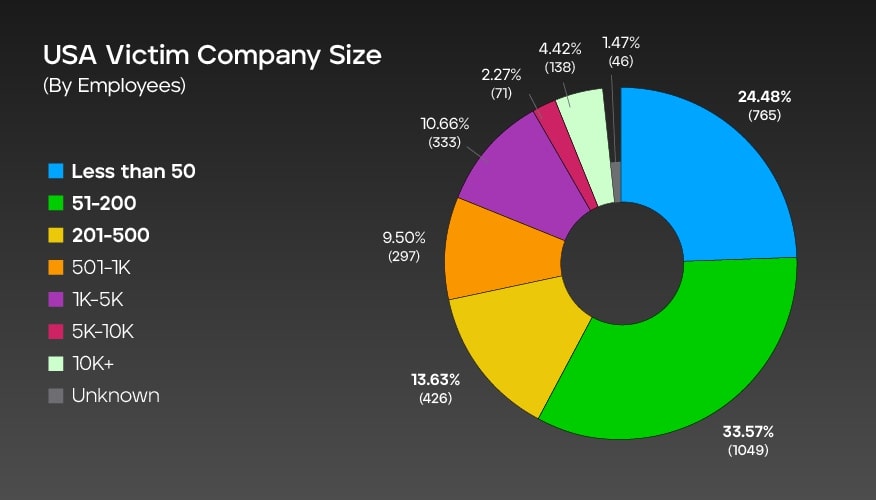
In the context of ransomware attacks in the United States, the graph shows the distribution of victim companies based on their size, measured by the number of employees. The graph indicates that most victim companies (33.57% ) are companies with 51 to 200 employees.
The second largest group are small businesses with less than 50 employees, making up 24.48% of the total. The number of victim companies decreases as the size increases, with the smallest percentages seen in larger organizations. Though the size of some victim companies is unknown, we were able to confirm employee counts for 3,125 companies accounted in this data.
Company size by revenue globally
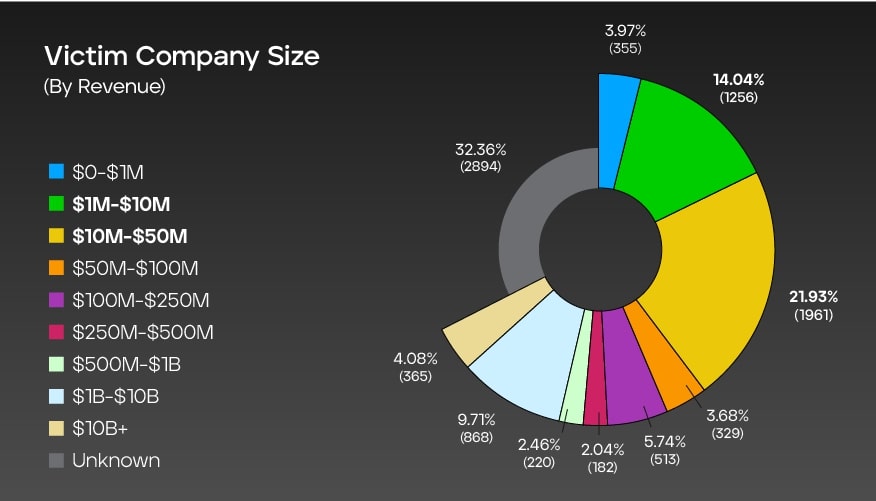
The graph presents a comprehensive breakdown of ransomware attack victims based on the size of their revenue. It shows the number of incidents recorded for each revenue range, along with the corresponding percentage distribution within a total dataset of 8,943 cases. Notably, the "unknown" category represents the largest share at 32.36%, indicating cases where the victim's revenue information was not disclosed or remains unidentified.
Among the specified revenue ranges, companies with revenue between $10 million and $50 million were most affected, accounting for 21.93% of the incidents. The $1 million to $10 million and $1 billion to $10 billion revenue ranges follow closely at 14.04% and 9.71%, respectively.
Company size by revenue: U.S.
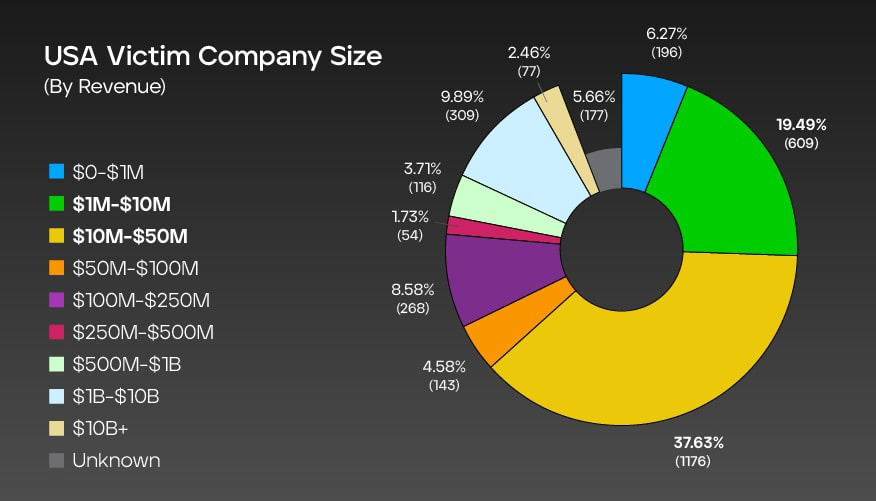
The graph shows an overview of ransomware attack victims in the U.S., categorized by the size of their revenue. It displays the number of incidents recorded for each revenue range, along with the corresponding percentage distribution out of a total of 3,125 cases.
Companies with revenue ranging from $10 million to $50 million were most impacted, accounting for 37.63% of the incidents. The $1 million to $10 million revenue range followed closely at 19.49%. Smaller companies with revenue between $0 and $1 million experienced 6.27% of the incidents, while larger enterprises with revenue exceeding $10 billion accounted for 2.46% of the cases.
Impacted sectors globally
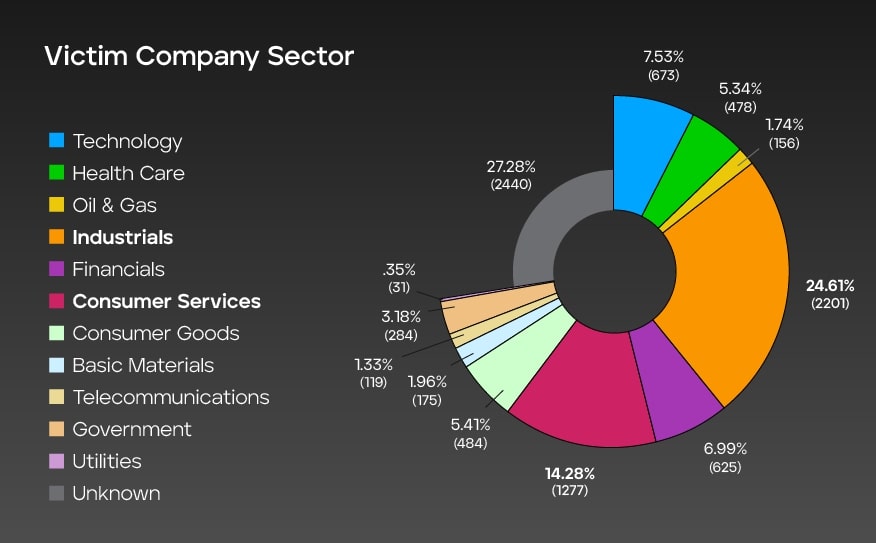
This graph presents the distribution of ransomware attack victims across various sectors. It shows the number of incidents recorded for each sector, along with the corresponding percentage representation within a total dataset of 8,943 cases.
Industrial and consumer services sectors are significantly affected, accounting for 24.61% and 14.28% of the incidents, respectively. Other sectors, such as technology, health care, and financial, also experienced a notable number of attacks. Interestingly, the "unknown" category represents the highest share at 27.28%, indicating instances where the victim's sector was not specified or remains undisclosed.
Impacted sectors in the U.S.
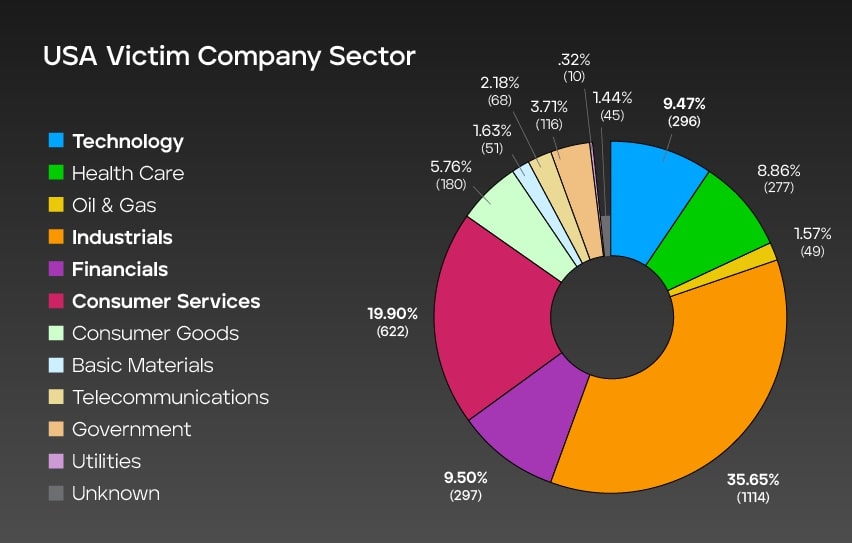
This graph offers valuable insights into ransomware attack victims in the U.S., categorizing them by industry and shows the number of incidents recorded for each sector, along with the corresponding percentage distribution out of a total of 3,125 cases. The data highlights the significant impact on the industrial and consumer services sectors, with 35.65% and 19.90% of the incidents respectively. The financial and technology sectors closely follow, accounting for 9.50% and 9.47% of the cases, demonstrating the broad reach of ransomware attacks across various industries.
Publicly exposed ransomware victims globally
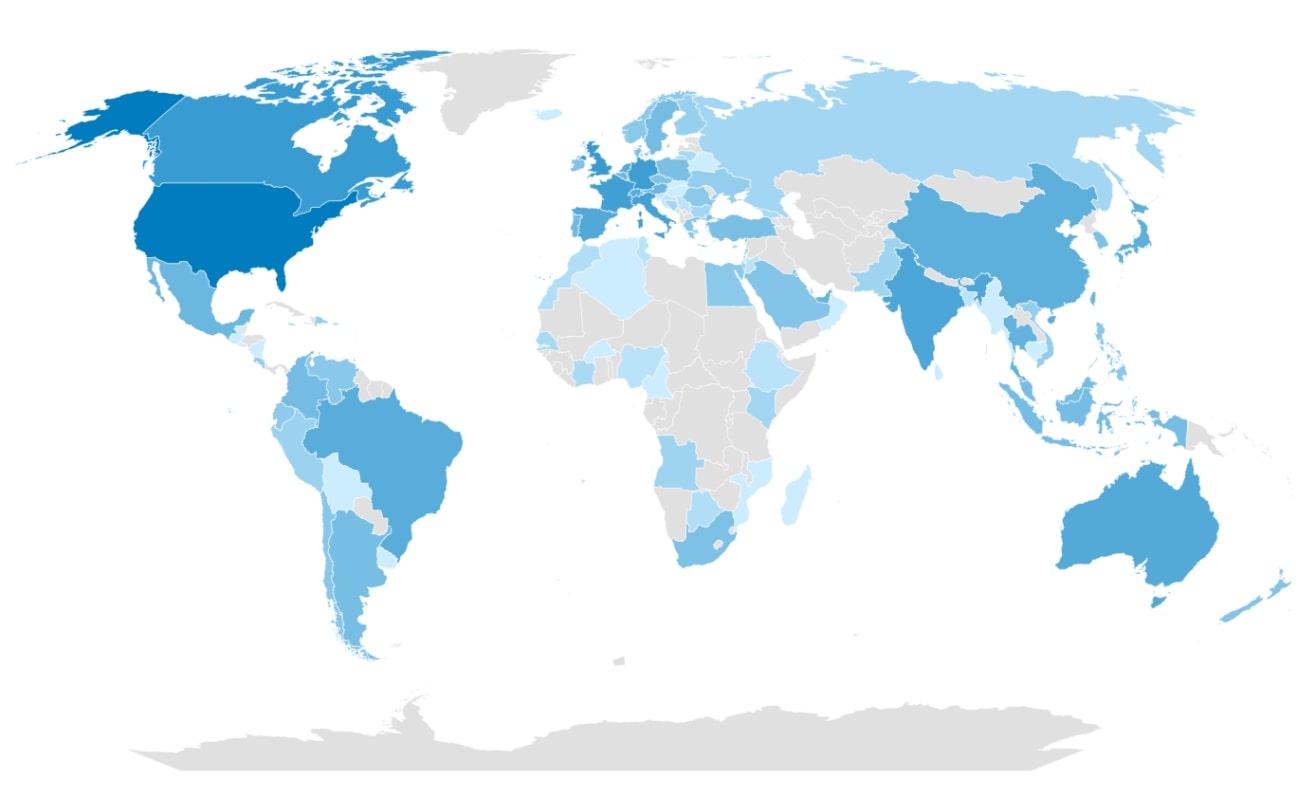
The heatmap above, derived from an extensive dataset of 8,493 victims, unmistakably illustrates that ransomware attacks predominantly focus on victims in the U.S., with the United Kingdom, Germany, Canada, and Italy following behind. However, it’s crucial to recognize that ransomware activities are not limited to specific countries. While certain nations may exhibit lower percentages, it doesn’t imply a diminished attractiveness to ransomware groups. Instead, it may suggest more precise targeting of attacks or the reluctance among the victims to report incidents.
Conclusion
Our analysis revealed several key trends and patterns within the ransomware victim demographic. Firstly, it became evident that ransomware attacks continue to be a pervasive threat affecting organizations of different sizes globally. It isn’t only the large organizations that get attacked. Based on the gathered datapoints we can conclude the following:
- Organizations in a size range from 5-500 employees have been targeted most.
- More than half of the U.S. victims had an average annual revenue from $1 million to-$100 million.
- Even though there were victims hit all over the world, most victim organizations in our dataset were in the U.S., predominantly in the consumer services, technology, financial, and industrial sectors.
From these first two conclusions, it’s clear that there is a significant trend amongst ransomware victims to be smaller or mid-sized businesses – not major corporations and enterprises. It’s unclear if this is due to active targeting from ransomware groups who are looking to avoid media and law enforcement attention, whether companies of this size are simply easier for these threat actors to infiltrate and compromise for the value of the ransom, or another reason. Following the COVID-19 pandemic though, many small and larger organizations started adopting more cloud tools and services as part of a digital transformation to support remote and hybrid workforces. Thus, it’s possible that these threat actors view even today’s small businesses as attractive targets, where a foothold on the internal network offers an attack vector to a broader cloud infrastructure.
Today's organizations are faced with a growing attack surface to cover with security controls. And this attack surface only becomes more complex and difficult to manage as organizations become more digital and connected. Based on our “Mind of the CISO” report, we established that organizations allocate about 34% of their IT budget for cybersecurity. It's clear that these cybersecurity budgets need to be allocated towards tools and services that offer intelligent, comprehensive and effective security protections.
We encourage all the readers of this ransomware victim blog to compare their organization to the victim statistics listed here and to review their current security controls against the findings from our Mind of the CISO report to better understand where they stand in their journey to successfully protect their organizations against the ransomware attacks. Trellix provides a much-needed world-class AI-powered platform and XDR for detection and prevention tools to mitigate the ransomware pandemic.
RECENT NEWS
-
May 19, 2026
Trellix Appoints Joe Chen as Chief Technology Officer
-
Apr 08, 2026
Trellix prevents enterprise data exposure in sanctioned and shadow AI
-
Mar 02, 2026
Trellix strengthens executive leadership team to accelerate cyber resilience vision
-
Feb 10, 2026
Trellix SecondSight actionable threat hunting strengthens cyber resilience
-
Dec 16, 2025
Trellix NDR Strengthens OT-IT Security Convergence
RECENT STORIES
Latest from our newsroom
Get the latest
Stay up to date with the latest cybersecurity trends, best practices, security vulnerabilities, and so much more.
Zero spam. Unsubscribe at any time.