Blogs
The latest cybersecurity trends, best practices, security vulnerabilities, and more

Trucking on with DotDumper
By Trellix · May 11, 2023
This blog was written by Max Kersten
On the 11th of August 2022, the initial public version of DotDumper was released. A brief refresh: DotDumper is an open-source automatic unpacker for DotNet Framework targeting files. This blog marks a public update which supports unmanaged hooks to successfully log process injection, a GUI-based log viewer, as well as improved command-line interface argument handling. These updates upgrade DotDumper’s capabilities to hook (and thus log) more data, along with more context, increasing the correlation of log entries within a single run, and between runs of different malware samples. The GUI-based log viewer allows one to easily load and filter the log that DotDumper created, breaking it down into easily digestible chunks for an analyst, freeing up valuable time during the analysis.
All code is publicly available on GitHub, along with precompiled binaries. Note that DotDumper, DotDumperNative, and DotDumperGUI are within separate repositories.
Unmanaged hook support to log process injection
DotNet-based loaders can be used to launch a non-DotNet-based payload. Malware writers, to avoid being detected when executing a binary that has just been written to disk, often inject the payload into another process. To interact with another process in such a way, actors often choose to use Windows API functions, much like they would when using an unmanaged language such as C(++). The previous version of DotDumper wasn’t able to hook such functions, and therefore couldn’t log those actions. This new version can hook, and therefore log, these function calls. This provides a more complete overview of the malware’s actions, along with a copy of the injected code as it is dumped.
A major part of this release is the ability to hook unmanaged functions from a managed context. The targeted function can be a managed or unmanaged function. The hook can be either managed or unmanaged, allowing any combination of a(n) (un)managed target function which redirects to a(n) (un)managed function. However, there’s a limitation due to the way the interoperability layer handles the calling of unmanaged functions: By hooking an unmanaged function while using a managed hook, the stack’s arguments will be unreadable. When hooking an unmanaged function while using an unmanaged hook, there is no such limitation.
In short, one can now hook any desired function, and redirect it to any given function, with a single caveat: an unmanaged function’s arguments cannot be read properly from a managed context.
To resolve the limitation, DotDumper opens a named pipe, via which a newly created unmanaged component communicates. This allows DotDumper to use its internal logging system with the arguments from the hooked function.
Since the DotDumperNative component is separate, and loaded during runtime, it is possible to edit existing hooks and only replace one component. For example, one can modify the unmanaged WriteProcessMemory hook, recompile the library, and put it in DotDumper’s folder. No changes within DotDumper itself are required for most of the changes, if the received data (and the order thereof) isn’t altered. Note that the unmanaged component should be (re)compiled for both x86 and x64 architectures. Based on the runtime, DotDumper loads the correct component.
DotDumperGUI
While DotDumper itself has no GUI, as it’s meant to be lightweight and easy-to-automate, a newly created component to view JSON-based logs does have a GUI: the aptly named DotDumperGUI. Written in C# using DotNet Core as a Windows Forms Application, this application is meant to run on Windows while leveraging the continuously developed DotNet Core framework. The figure below shows the GUI.
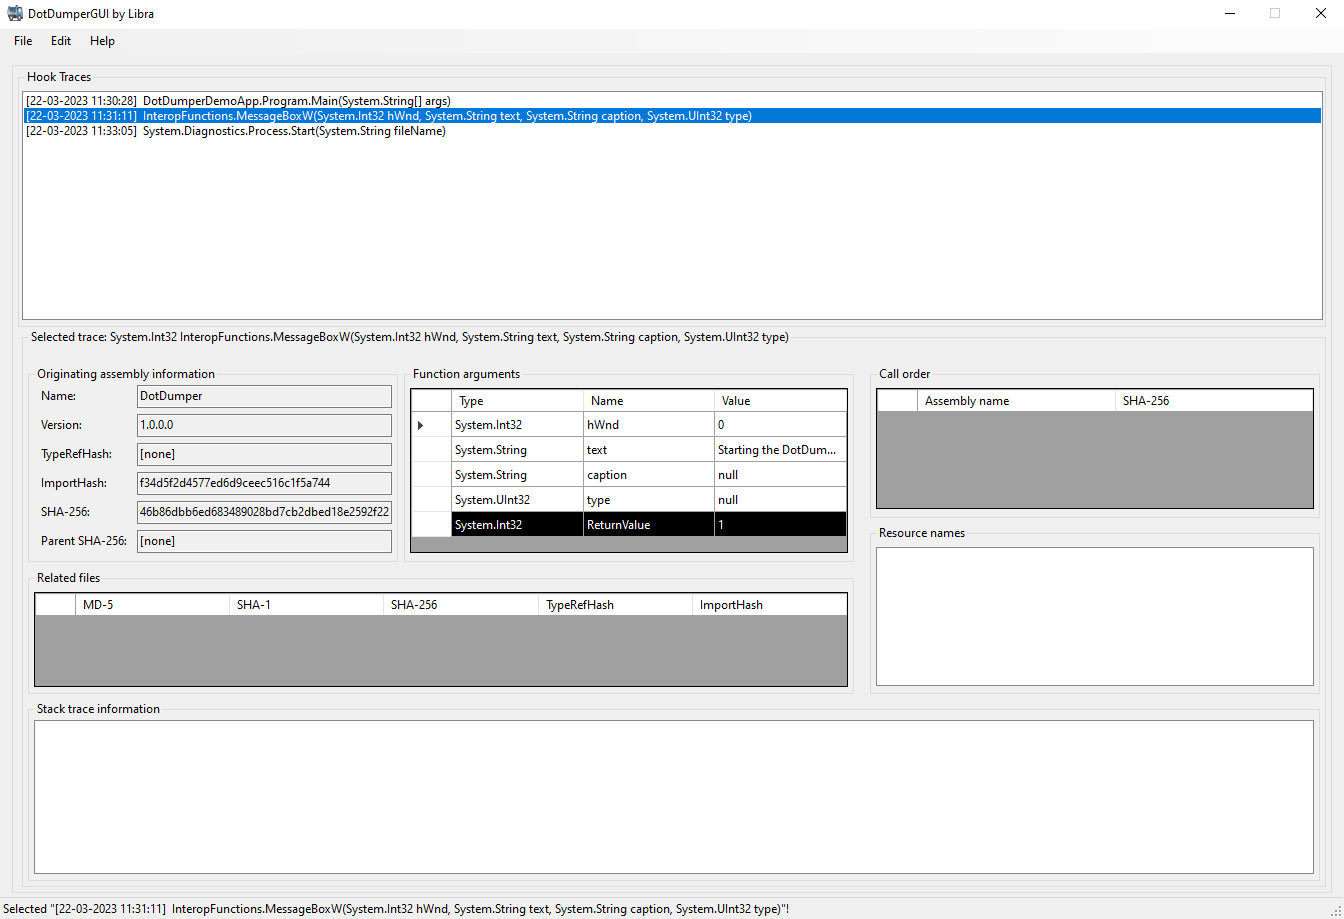
One can load a JSON log from a DotDumper run and easily navigate through it. More information on each log entry is given once selected, as seen in the figure above. Filters can then be applied based on the inclusion and exclusion of keywords in specific fields, along with additional constraints. This decreases the time spent on the analysis of a lengthy log, making it a quick walk in the park instead. The filtered results can be saved as a new JSON log. Additionally, one can save the filter itself for future reuse. The figure below shows the filter interface.
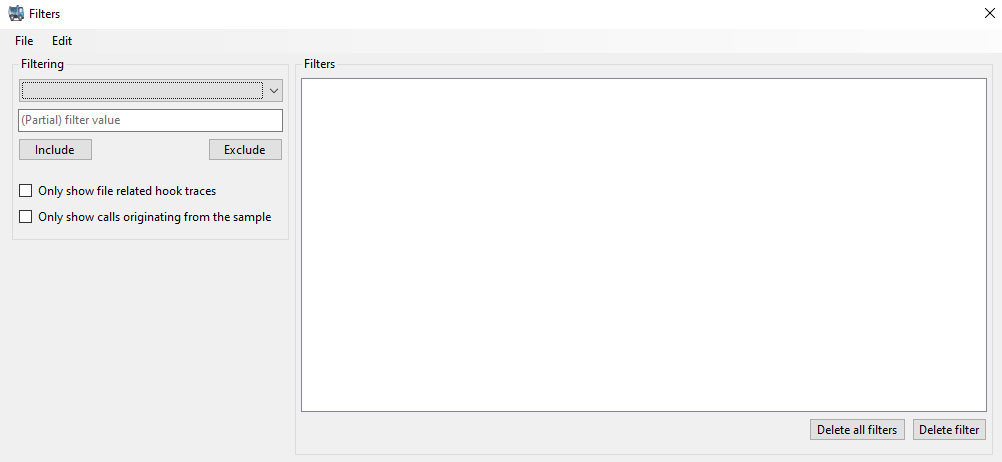
Via keywords and two checkboxes, one can create any number of filters – though it is possible for users to create conflicting filters, i.e., the inclusion and exclusion of the same filter value will generate no results. One can delete a filter or simply clear all filters, if necessary. This way, noise can easily be filtered from the log, allowing the analyst to swiftly slice through the log. The drop-down box specifies which field should be filtered, as seen below.
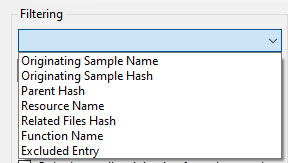
Note that the (partial) filter value doesn’t support regular expressions, as all text will be interpreted as literal text. Upon creating or deleting a filter, the main interface is updated automatically to reflect the changes. One can keep both the main UI as well as the filter creation UI open to filter the results more easily.
The main UI has several context menus, most of which are self-explanatory. The context menu when right-clicking on a selected trace is the most comprehensive, and allows one to easily filter based on the selected trace.
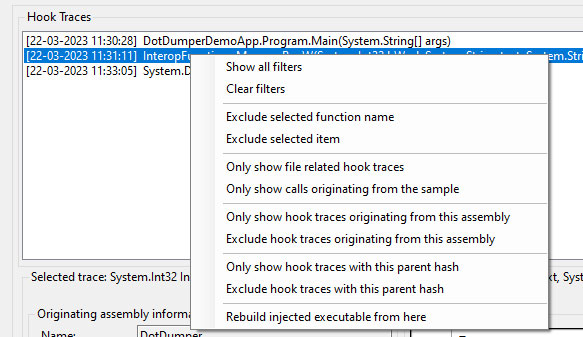
Noteworthy here is the “Rebuild injected executable from here” feature. This feature takes all traces from the selected trace until the end of the loaded non-filtered traces, and concatenates all files that are linked to the traces in chronological order. To use this feature, one must add filters to ensure only the relevant traces are visible, with no noise in-between the calls. A new file is then created in the same folder as the loaded JSON log file from DotDumper’s run. The file name will be equal to the SHA-256 hash of the data.
Sandbox timeout support
While the sandbox timeout support feature hasn’t been changed nor modified, it wasn’t documented before. Since DotDumper executes the file it is given, its execution will continue until the sample terminates. Malware often enters a “waiting” state, where a certain condition must be met before it reactivates, or the malware continues execution in a different process (with the help of process injection). For example, a newly created thread in a hollowed process only returns once it is finished.
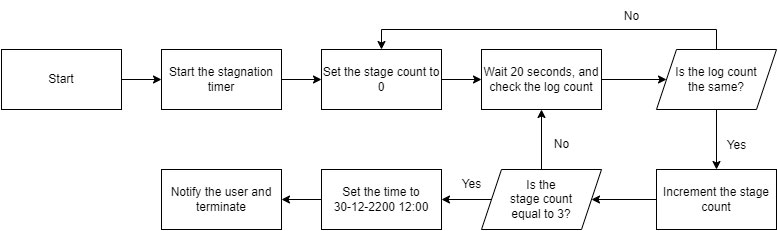
To avoid stalling, DotDumper has a stagnation handler. Each time a hook’s results are logged, a counter is incremented. If this counter is unchanged after three consecutive 20-second intervals, DotDumper assumes a stagnated state is encountered. In that case, the system’s time is set to 30-12-2200 12:00 to force the sandbox to time out, after which it notifies the analyst via the logger and terminates itself. The sandbox timeout occurs when the elapsed time from the current date until the newly set date exceeds the usual 5 or 10 minutes. Even if the sandbox runtime is set to hours or days, it is exceeded.
The reason to cut the analysis short is to save time and resources, since a submission with a 10-minute timeout might only take 2 minutes to run. As such, one would be able to run multiple samples in the same time span with the stagnation handler. An overview of the stagnation handler’s logic is shown below.
The command-line interface
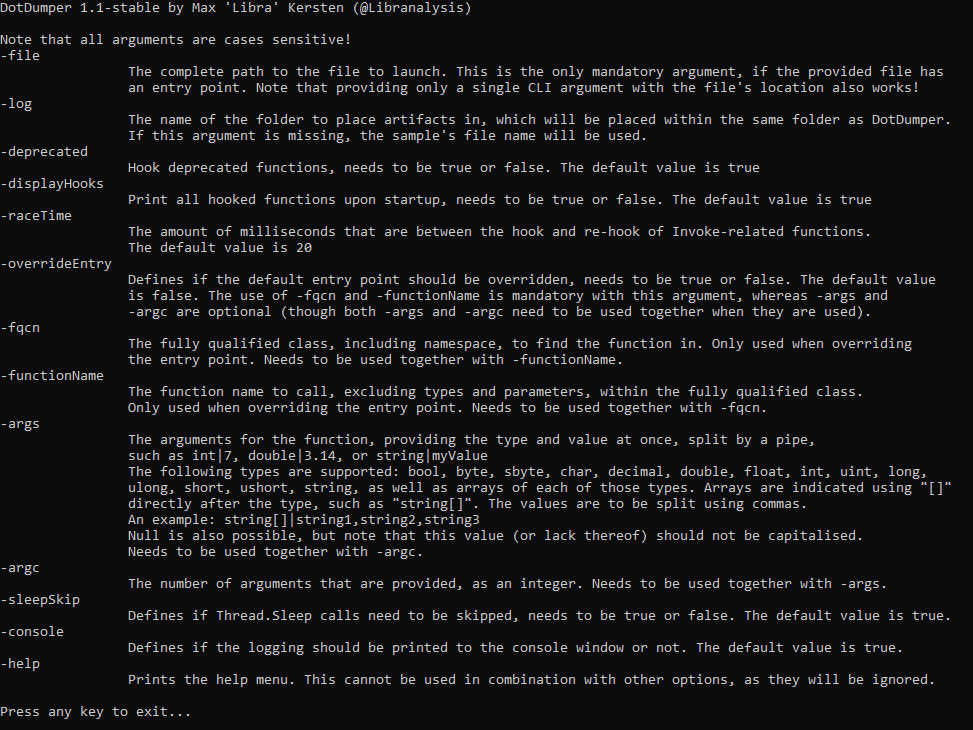
Previously, the command-line interface (CLI) required at least two arguments: “-file C:\file.exe”. In the new version, one can simply use the file path as the first argument. This makes the tool even more intuitive and prevents the confusion some newer users had. The new help menu is shown in the screenshot below.
Dependencies
While the first version did not use any dependencies, the new version uses PeNet. A requirement for DotDumper’s dependencies is to avoid a complicated build chain to compile a custom version of the tool. Since PeNet is available on NuGet, one can simply pull it during the normal build process. With the help of this library, the import hash, TypeRefHash, and the authenticode hash (SHA-256 based) of encountered data is calculated, whenever possible.
Additionally, the SHA-384 and SHA-512 hashes are calculated for encountered data, using the DotNet Framework’s internally available classes.
Improved readability
Lastly, the human-readable logging (which is printed in the log.txt file during runtime, and printed in the console’s standard output) is now more readable. Clutter is now avoided by no longer printing empty values. For example, the TypeRefHash can only be calculated for DotNet-targeting binaries. In addition, if a blob of data (i.e., a base64-decoded yet still encrypted byte array that has been obtained via a hook) was not the correct file format, the hash would previously appear as an empty string, while it is now omitted. Omitting irrelevant data makes the logs easier on the eyes, allowing analysts to easily navigate through the log without getting lost in unimportant details.
Note that the omission of such data only applies to the human-readable output. The machine-readable output, available in both JSON and XML formats, still contains these fields, but the original empty strings are present if the field could not be calculated.
Bug fixes
This update includes several bug fixes, most of which had to do with minor edge cases that were revealed when used. None of them is worthy of a specific explanation in this blog, as most of them simply refer to a missing null-check. The one issue in the GitHub repository was not a bug report, but rather a question about the aforementioned stagnation handler.
Developer guidelines
For those who aren’t keen to rebuild the projects from their source: a precompiled and preconfigured archive with all required components is available in the DotDumper release section. For those who are interested in modifying the project to suit their specific needs, or to enhance the project as a whole, details are given below.
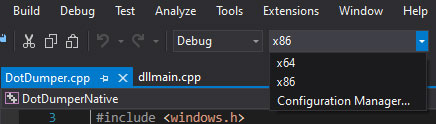
DotDumper, DotDumperNative, and DotDumperGUI work together, although not all three components communicate with one another during runtime. The GUI interacts with a JSON-based log file on disk, which should only be used after DotDumper completes its execution, although each incremental log overwrites the complete JSON log during runtime. The native libraries from DotDumperNative need to be compiled for both x86 and x64 architectures respectively, using Visual Studio 2019 (or later). The screenshot below shows the profiles. One can use the debug profile for both architectures when building the libraries.
Depending on the chosen architecture, the resulting library resides in a specific folder. For x86, it is within the “Debug” folder of the project’s root, whereas the x64 library resides in the “x64\Debug” folder, also located within the project’s root. In either case, one only needs the “DotDumperNative.dll”, and to place the files within the same folder as “DotDumper.exe” of DotDumper. The libraries should be to renamed “DotDumperNative_x86.dll” and “DotDumperNative_x64.dll” for each respective architecture. If this is not done, DotDumper will display an error message upon startup!
The libraries are loaded dynamically during DotDumper’s runtime, and can be replaced when DotDumper is not running. The communication between the native libraries and DotDumper itself is done via a named pipe, meaning that DotDumper should only be updated for changes that interfere with the named pipe’s communication scheme, or when adding or removing hooks. Adding or removing hooks requires changes to DotDumper’s main component as well, but the relative freedom this gives to update each component is included in the DotDumper design principles.
Trellix Product coverage against Process Injection
Although DotDumper is a general tool for analyzing DotNet malware, and DotNet malware is capable of performing any attack, this blog does specifically mention DotNet malware that leverages process hollowing. We would be remiss not the mention that Trellix EDR and Detection as a Service both provide process hollowing detection!
Detection as a Service
Email Security
Malware Analysis
File Protect
_api_process_hollowing
_api_process_hollow
_api_process_hollowed_msbuild
_api_process_hollowed_installutil
_api_process_hollowed_regasm
_api_process_PE_into_regasm
_process_chain_svchost_powershell2
_hunting_beacon_cs
_hunting_process_inj2
_hunting_process_inj_epp
_hunting_explorer_injection
_hunting_susp_proc_exec
_hunting_sliver_getsystem
_hunting_sliver_getsystem2
_Api_thread_hijack_injection
Conclusion
All in all, this update further matures DotDumper for analysts, especially with the subsequent release of DotDumperGUI. More features may be added in the future. If you have an idea that you’d like to work out, feel free to create a pull request. Even the idea in and of itself is enough, as others can work on said idea. Do not let a lack of knowledge of the project or DotNet hinder you! If you need help along the way, or if you’ve found a bug you’re unsure how to fix , please open an issue on the related GitHub repository of DotDumper, DotDumperNative, and/or DotDumperGUI.
RECENT NEWS
-
May 19, 2026
Trellix Appoints Joe Chen as Chief Technology Officer
-
Apr 08, 2026
Trellix prevents enterprise data exposure in sanctioned and shadow AI
-
Mar 02, 2026
Trellix strengthens executive leadership team to accelerate cyber resilience vision
-
Feb 10, 2026
Trellix SecondSight actionable threat hunting strengthens cyber resilience
-
Dec 16, 2025
Trellix NDR Strengthens OT-IT Security Convergence
RECENT STORIES
Latest from our newsroom
Get the latest
Stay up to date with the latest cybersecurity trends, best practices, security vulnerabilities, and so much more.
Zero spam. Unsubscribe at any time.